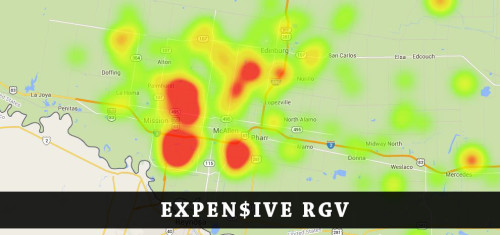
Although it is not a fire-proof method, home prices generally indicate how affluent a neighborhood is. However, historical pricing data and even general tax information sometimes do not yield the full picture of a neighborhood. Certain home features are not taken into account by property evaluators and people tend to hold back information from self-reported surveys. We wanted to provide our clients with a current and global picture of the most expensive areas in the Rio Grande Valley. We used current homes for sale to find the most expensive real estate areas in an attempt to better understand the RGV. Armed with over 400 current homes for sale (March 2015), we created a heat map based on home prices and specific location to highlight the most expensive areas of the RGV at the moment (only taking into consideration single-family home properties in the Hidalgo County, we will post the Cameron and Starr County in the coming weeks).
Below are the results of our analysis.
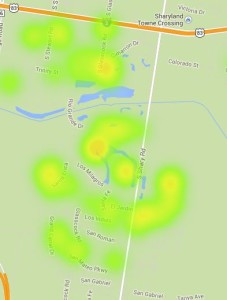
South Sharyland area
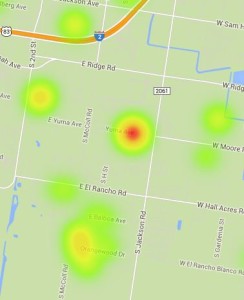
El Rancho area
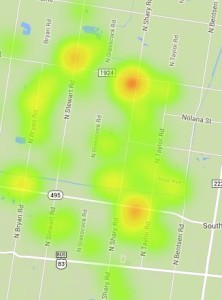
North Sharyland area
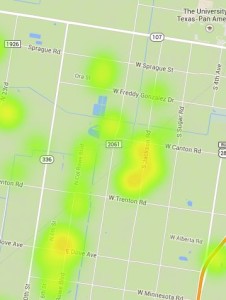
Nolana and Jackson area
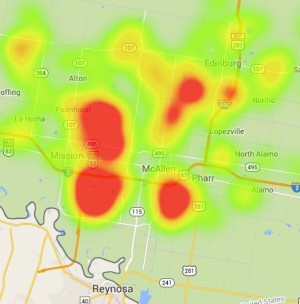
General macro area based on current home price